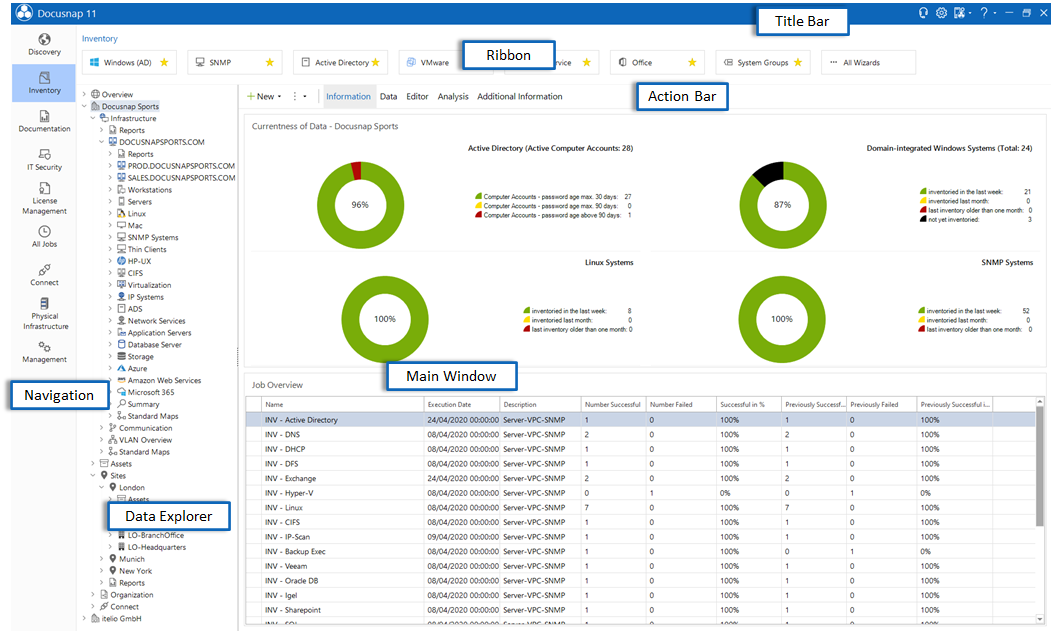
The user interface for Docusnap is subdivided into navigatin, ribbon, data explorer etc.

Ribbon
Docusnap wizards, dialogs and features will generally be accessed from the ribbon. The ribbon is subdivided into several tabs according to functionality.
Data Explorer
In the Data Explorer, information is hierarchically displayed as a tree view. There are four different tree views. The various tree views can be opened as needed from the navigation pane.
Action Bar/Main Window
In the main window, information is displayed in various views. In the action bar you can switch between the different tabs.
The main window displays data for the objects selected in the Data Explorer. In the Information tab, dashboards provide a quick overview of how up-to-date the inventoried data is. Additional information can be specified using data entry screens in the editor. Additional information in the form of comments, financial records, passwords, contracts and tasks can be added. The reports will be executed on their own tab. The permissions for the folder structure will be analyzed using the Permission Analysis process.
Navigation
In the navigation you can switch between the different explorers. By activating the Display of Time Zones, the output of the scan date can be adjusted in the data explorer. In the titel bar of Docusnap it can be selected which time zone is used for the display.
Titel Bar
The title bar is used to configure Docusnap - Client and Server - and to open the options. In addition, the title bar is used to open Quick Support, activate the debug mode and analyze the debug log.
